[An earlier version of this article appeared in Forbes.com.]
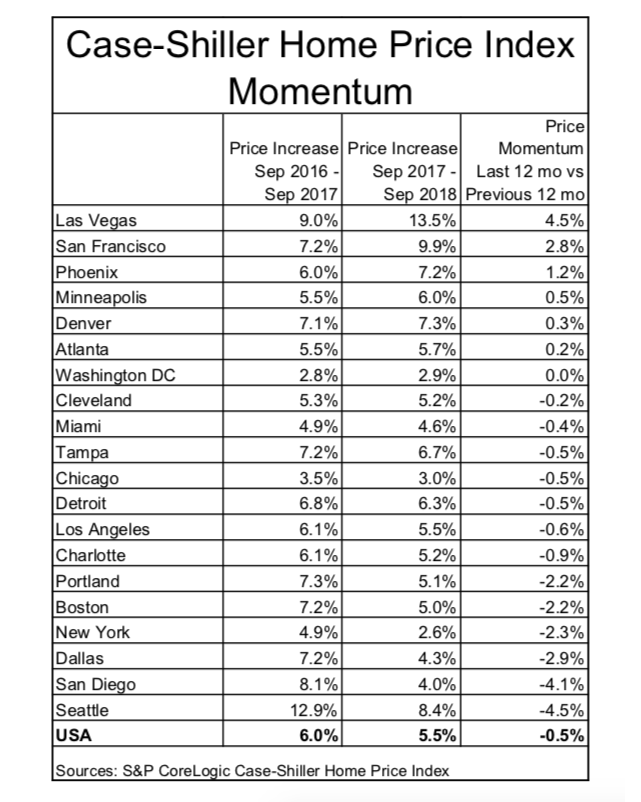
U.S. homes price were up 5.5% in September compared to September 2017. That was down a bit from the previous 12 months when U.S. home prices had increased by 6.0%, at least according to the S&P CoreLogic Case-Shiller Home Price Index.

Interactive Case-Shiller Graphs.
Las Vegas remained the hottest city for home price appreciation, up 13.5% over the last 12 months, and San Francisco came in No. 2 with 9.0%.
Seattle, which was the hottest market for many months until this summer, was still appreciating rapidly at 8.4%, but that was down 4.5 percentage points from the previous 12 months when Seattle home prices increased 12.9% (September 2016 – September 2017).
Of the 20 cities detailed by the Case-Shiller index, home price appreciation accelerated in six cities but decelerated in 13 cities.
The housing market has been in the news a lot the last couple of months. New home sales, which are often a leading economic indicator, have been slowing down.
Although home prices aren’t increasing as fast as they were in the previous 12 months, none of the 20 cities covered by the Case-Shiller Index showed a price decline, only a general deceleration in price gains.
Despite the strong appreciation over the last 12 months, the worry is this reduced upward price momentum might signal the beginning of the end of the multiyear bull market in U.S. home prices.
For 2019 anyway, home prices are very likely to continue to increase, but the size of the increases will also likely continue to decrease.
# # #
One Response to Home Prices Still Increasing But Not As Fast As Before In Most Cities
Orange County – July-Sept – 2017 vs 2018
Median home price up 3.4%
Number of home sales DOWN 11.5%.
From Orange County Register, https://www.ocregister.com/2018/11/21/homebuyings-summer-chill-how-sales-fell-13-in-newport-beach-laguna-beach-costa-mesa/
Comments are closed.